Figure 4.

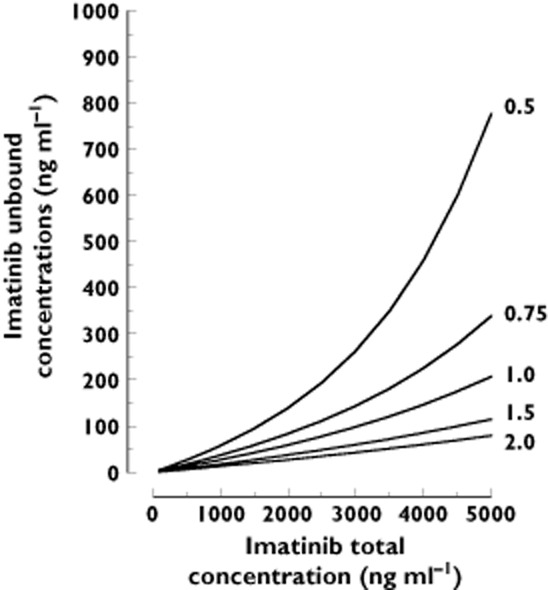
Imatinib total concentrations Ctot vs. predicted free concentrations based on the final model determined in this study, integrating AGP values of 0.5, 0.75, 1, 1.5 g l−1 and 2 g l−1

Imatinib total concentrations Ctot vs. predicted free concentrations based on the final model determined in this study, integrating AGP values of 0.5, 0.75, 1, 1.5 g l−1 and 2 g l−1