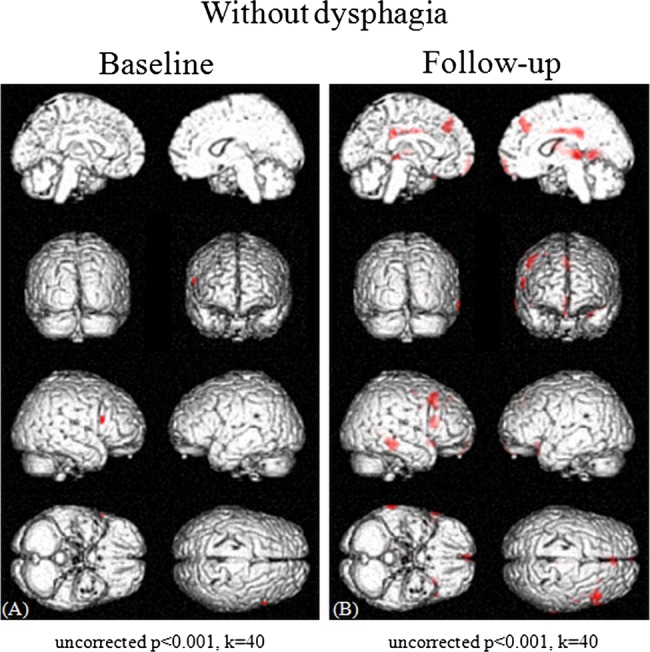
Figure 4.

Cross-sectional analyses of brain maps showing differences between PD patients without dysphagia and normal control subjects at baseline (A) and after a 3-year follow-up period (B). Various areas showed differences in the standardised PET data, and areas with a height threshold of p<0.001 (uncorrected) and an extent threshold of 40 voxels are illustrated. The PD patients without dysphagia showed virtually no hypometabolism at baseline (uncorrected p<0.001, threshold=40 voxels) (A) and only a small degree of hypometabolism in the SMA and ACC after a 3-year follow-up period (uncorrected p<0.001, threshold=40 voxels) (B) compared with normal control subjects.
