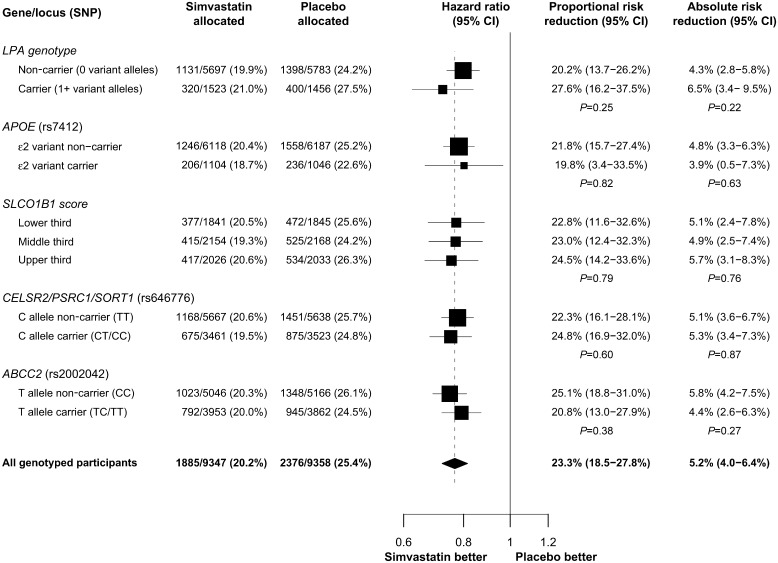
Figure 4.
Effects of simvastatin on major vascular events by genotype. Proportional and absolute risk reduction are shown by genotype for loci that were significantly associated with proportional lipid response (P < 0.001). Estimates are given with 95% confidence intervals and P-values are given for the trend across genotypes. Hazard ratios and 95% CIs are plotted with box sizes weighted by the inverse-variance of the estimate. The hazard ratio in all genotyped participants is shown by a dashed line.

