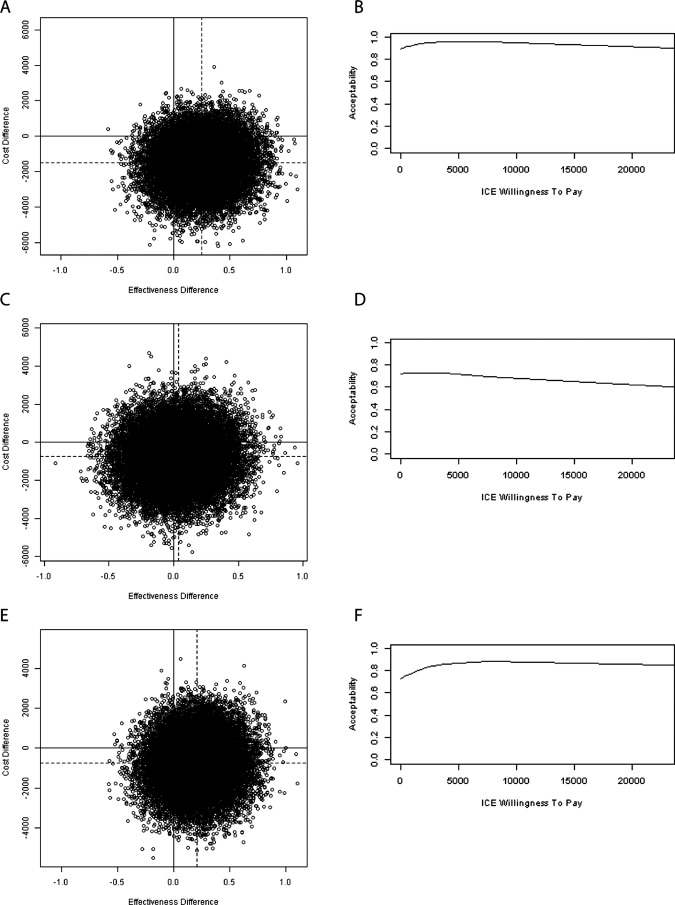
Figure 1.
Scatterplot of incremental cost-effectiveness ratio pairs based on the results of bootstrap resampling technique (25 000 replicates) and cost-effectiveness acceptibility curves for (A and B) SOD vs SC, (C and D) SDD vs SC and (E and F) SOD vs SDD. SOD, selective oropharyngeal decontamination ; SDD selective decontamination of the Digestive tract; SC, standard care.

