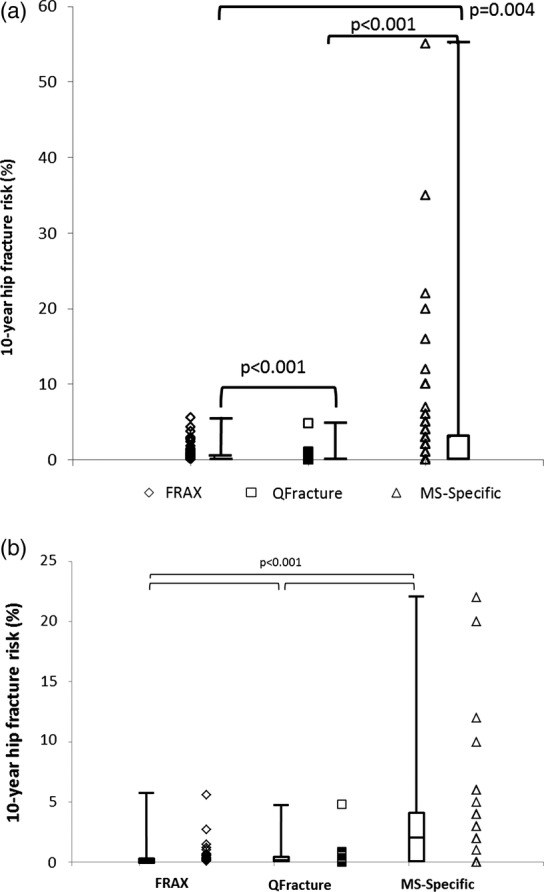
Figure 3.

(A) 10-year hip fracture risks generated by each of the three risk scoring algorithms for all patients. The box represents the 25th–75th centile bisected by the median, with the whiskers the range. (B) 10-year hip fracture risks generated by each of the three risk scoring algorithms for those patients aged 40 or over only. The box represents the 25th–75th centile bisected by the median, with the whiskers the range.
