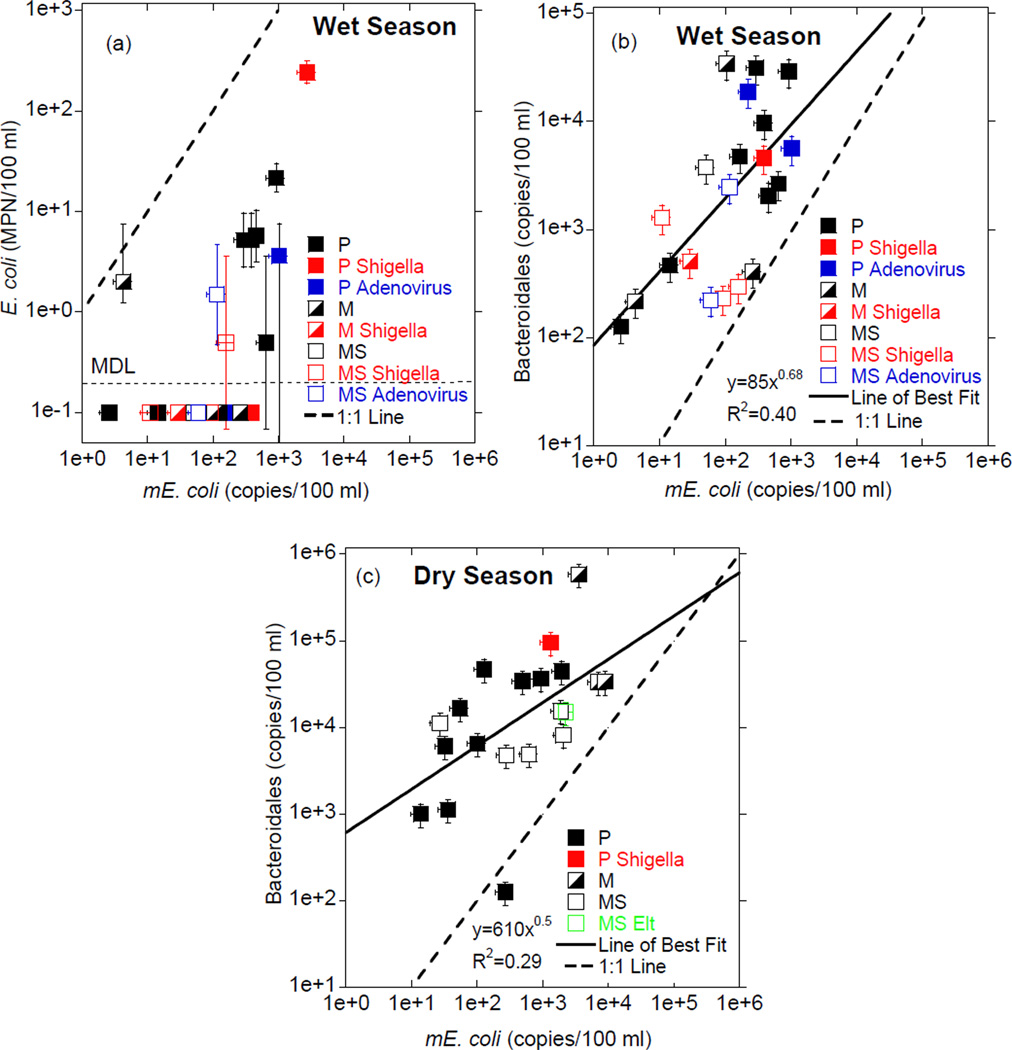
Figure 6.
Comparison of FIB concentrations and pathogen presence/absence during wet (n=22) and dry season (n=20) snap shot sampling events. (a) Comparison of synoptic measurements of cultured E. coli (MPN/100 mL) and mE. coli (copies/100 mL) from the wet season snap shot sampling event. The cultured E. coli method detection limit (MDL) was 0.5 MPN/100 mL. (b) Comparison of Bacteroidales and mE. coli concentrations during wet season snap shot. (c) Comparison of Bacteroidales and mE. coli during dry season snap shot. Cultured E. coli was not measured synoptically during the dry season snap shot sampling event. Samples where no pathogens were detected are indicated by black symbols. Samples positive for Shigella, EltA (ETEC E. coli) and Adenovirus are indicated by red, green and blue, respectively.

