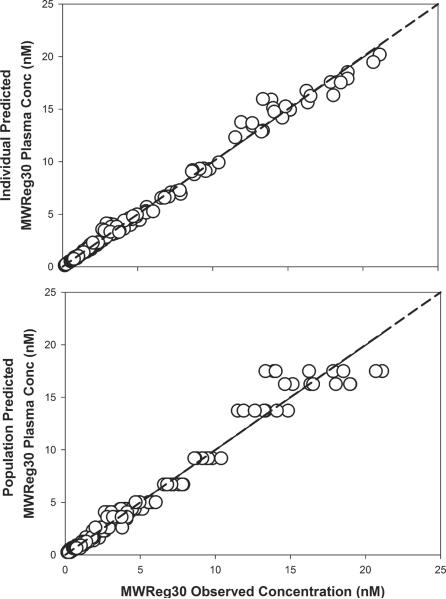
Fig. 6. Goodness-of-fit plots for MWReg30 plasma concentrations.
Scatter plots and regression lines (solid) for MWReg30 observed and predicted concentrations in plasma. Shown are MWReg30 plasma individual predictions vs. observed values (r2=0.99), and MWReg30 plasma population predictions vs. observed values (r2=0.97). The dotted lines represent the line of identity.

