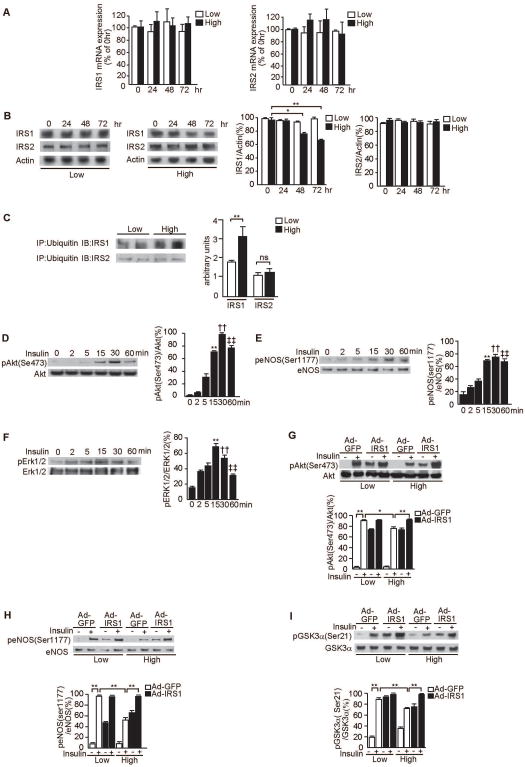
Figure 7. Effect of glucose levels on the association of IRS1/2 with ubiquitin and glucose levels on the activation of Akt, eNOS, Erk1/2 and overexpression of IRS1 in RGEC.
A. Time course for the effect of high glucose levels on mRNA gene expression for IRS1 and IRS2 as measured by real time RT-PCR. RGEC were incubated with low glucose (5.5mM) or high glucose (20mM) as indicated. One of three independent experiments is shown.
B. Time course for the effect of high glucose levels on the protein expression of IRS1 and IRS2. RGEC were incubated with low glucose (5.5mM) or high glucose (20mM) as indicated. Data from three experiments were quantitated by densitometry. *P<0.05, **P<0.001.
C. Immunoprecipitation with antibodies against ubiquitin and subsequent immunoblotting analyses of the precipitate with anti-IRS1 or anti-IRS2 antibodies showed increased amounts of polyubiquinated IRS1 in high glucose condition. Data from three experiments were quantitated by densitometry. **P<0.001.
D–F. Time course of phosphorylation of Akt (D), eNOS (E) and Erk1/2 (F) by insulin. RGEC were incubated with 100nmol/l insulin for the indicated time. One of three independent experiments is shown. **P<0.001, ††P<0.001, ‡‡P<0.001 vs. 0 minutes.
G–I. Effect of IRS1 overexpression in RGEC on insulin–stimulated p-Akt (G), p-eNOS (H) and p-GSK3α (I). After RGEC were infected with Ad-GFP or with Ad-IRS1, cells were stimulated with insulin (100nmol/l, 30 minutes) as indicated in low glucose (5.5mM) or high glucose (20mM). One of three independent experiments is shown. *P<0.05, **P<0.001. These data are expressed as means ± SD.

