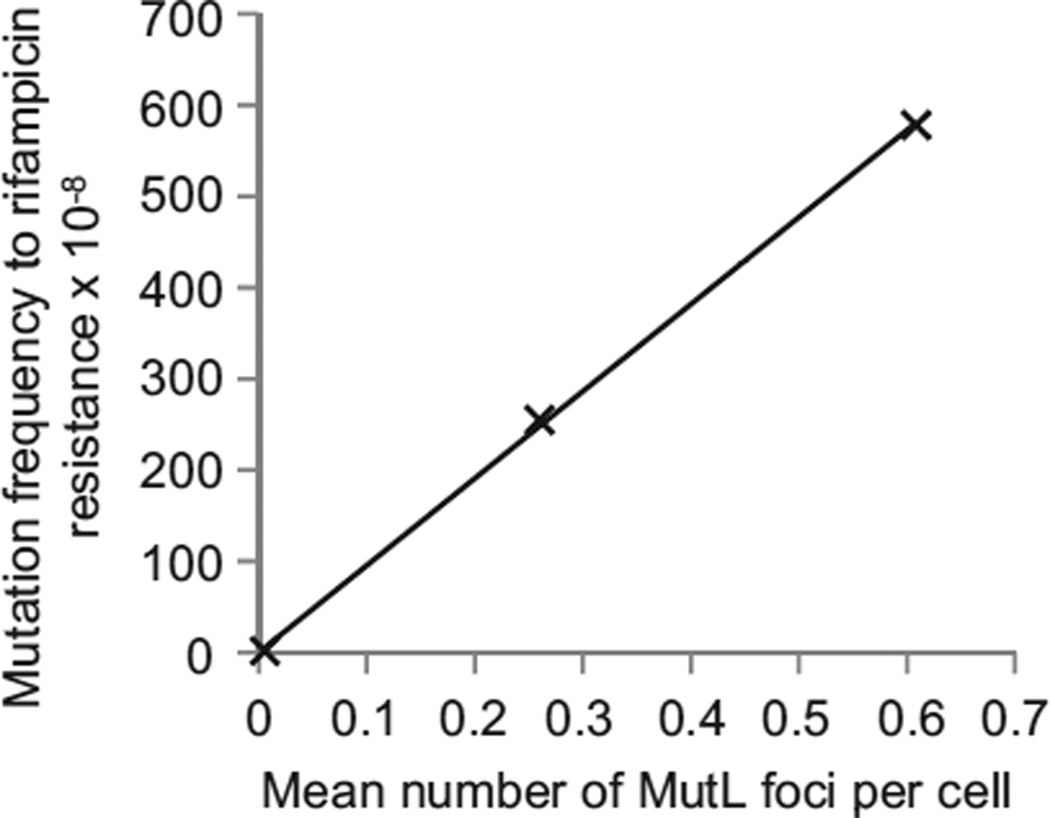
Figure 4. Number of eGFP-MutL Foci Is Linearly Related to the Mutation Frequency.
The plot shows the correlation between eGFP-MutL focus frequency and frequency of colonies that contain spontaneous mutations to rifampicin resistance (R2 = 0.999) for three strains with different mutation rates: mutL, mutL mutH, and mutL mutD5, all expressing eGFP-MutLWT. Assuming 2.0 genomes per cell and a target size of 69 different point mutations that can lead to rifampicin resistance, we calculate that MutL focus corresponds to a probability of 69/(2.0 × 3 × 4.5 × 106) = 2.5 × 10⁻⁶ of observing a mutation to rifampicin resistance in one of the cell’s descendants. We observe that each focus corresponds to a probability of obtaining a rifampicin-resistant colony of 8.2 × 10⁻⁶; this discrepancy is in the expected direction because we measured the frequency of mutant cells, rather than the mutation rate, and mutations that arise earlier in the culture give rise to more mutant colonies than those that arise later [1]. See also Table S4.

