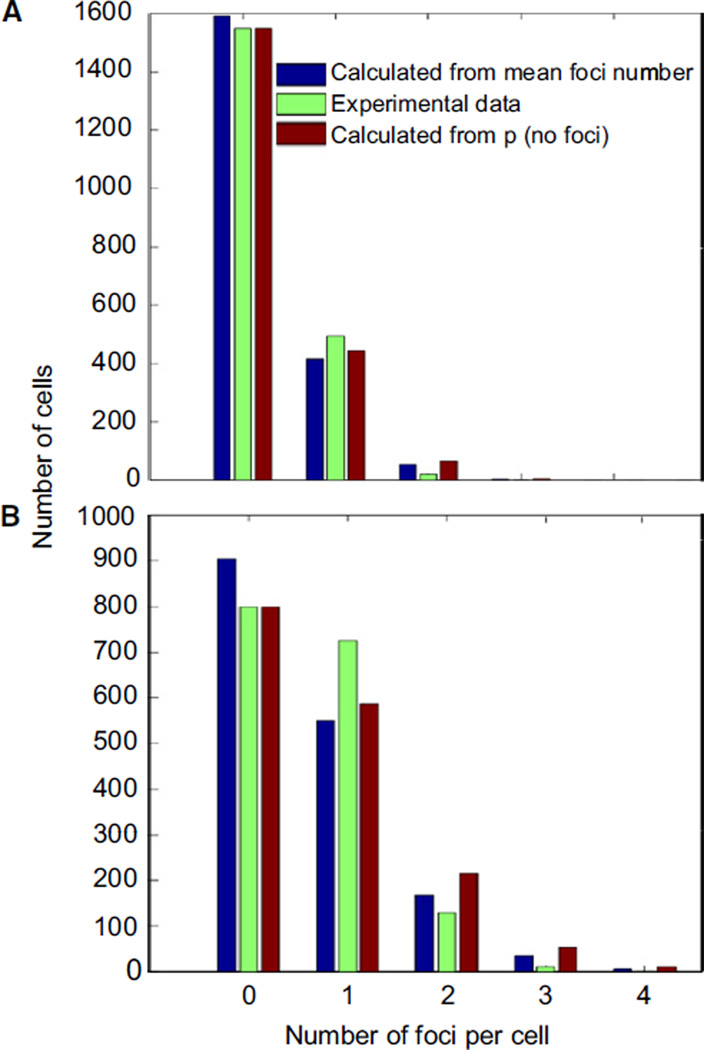
Figure 5. Mutation Rate in the Population Is Roughly Uniform.
(A and B) The plot shows the observed and calculated frequency of cells with a different number of foci for mutL mutH strain expressing eGFP-MutLWT (A) and mutL mutD5 strain expressing eGFP-MutLWT (B). The expected number of foci was calculated according to the Poisson distribution based on two different estimates of the mean number of foci per cell: (1) directly calculating the mean number of foci from the different frequency classes, which may be a slight underestimate, because if two foci are close together in the cell, they cannot be resolved from each other, and (2) using the frequency of cells that have no focus and the relationship p(no focus) = e−m, where m is the mean number of foci per cell.

