Figure 4.
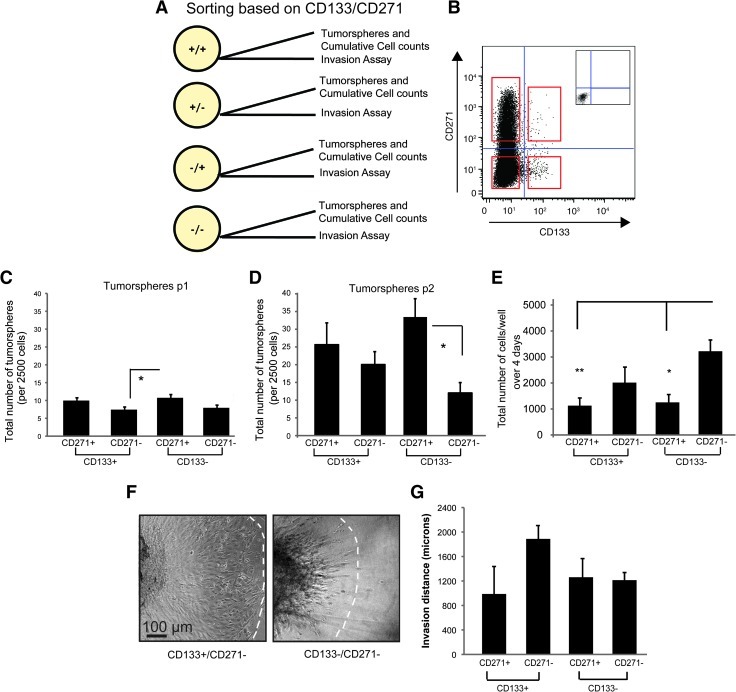
CD271 selects for cells exhibiting higher self-renewal capacity and CD133 selects for cells demonstrating higher invasion. (A) Schematic depicting initial two-marker sorting strategy to obtain four subpopulations. (B) Representative dot plot of sorting paradigm used to select cells based on CD133/CD271 expression. Red squares depict cell populations from all four quadrants to be sorted. (C, D) Tumor sphere assays for MB subpopulations following FACS. (C) Tumor spheres sorted on CD133/CD271 at the first passage (p1) following FACS; N = 3 independent experiments. (D) Tumor spheres sorted on CD133/CD271 at the second passage (p2) following FACS. Error bars, SEM; *P < .05. (E) Average total number of cells/well in adherent culture following FACS. Error bars, SEM; *P < .05, **P < .01; N = 3 independent experiments. (F, G) Invasion assays from subpopulations sorted on CD133/CD271. (F) Representative images of the highly invasive CD133+/CD271- subpopulation and the less invasive CD133-/CD271- subpopulation after 3 days in collagen gels. Scale bar, 100 µm. (G) Quantification of invasion for each subpopulation after 3 days in collagen following CD133/CD271 sorts. Error bars, SEM; N = 2 independent experiments.

