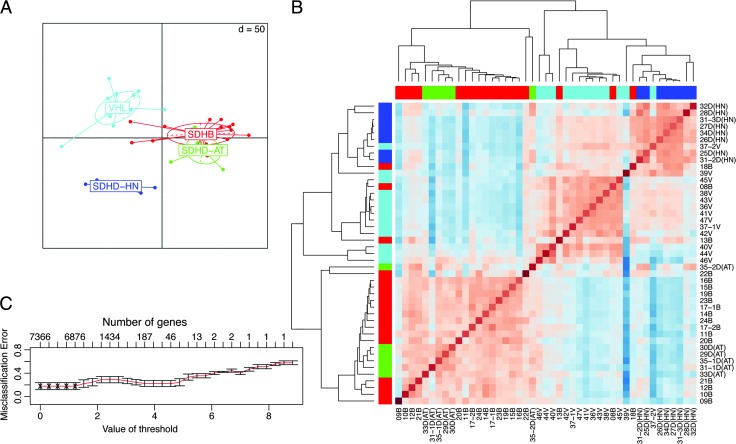
Figure 2.
Unsupervised analysis of tumors with SDHB, SDHD, and VHL mutations. (A) Group level principal component analysis showing association of the different tumors. Projection lines from each group correspond to individual sample locations on the resulting axes. (B) Heatmap of a pairwise correlation of genes from significance analysis for microarrays. Hierarchical cluster analysis was performed by average linkage and correlation distance metrics. (C) Class prediction results of the nearest shrunken centroid model. Cross-validation errors of the classifiers are shown as a function of the threshold parameter. The value giving minimum errors was chosen to give a selected list of genes.

