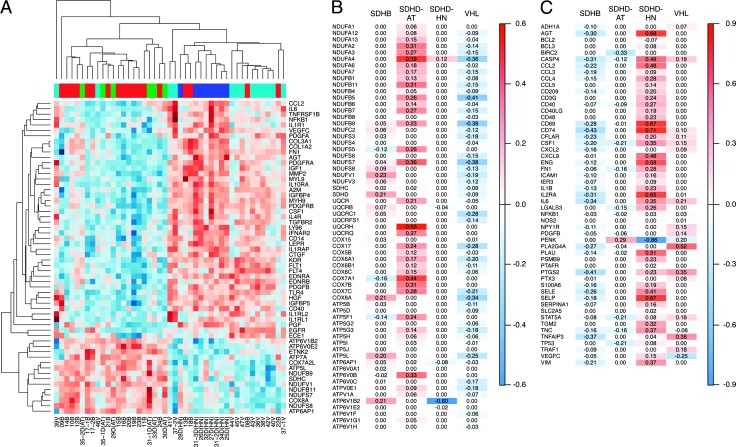
Figure 3.
Canonical pathways associated with the tumor subgroups. (A) Heatmap of oxidative phosphorylation and hepatic fibrosis-related transcripts selected by IPA. (B) Mean expression score of oxidative phosphorylation complex subunits. (C) Mean expression of NFκB target genes in the tumor subgroups. Red indicates increased and blue decreased expression relative to normal medulla and the other PHEO/PGL subtypes.

