Fig. 4.
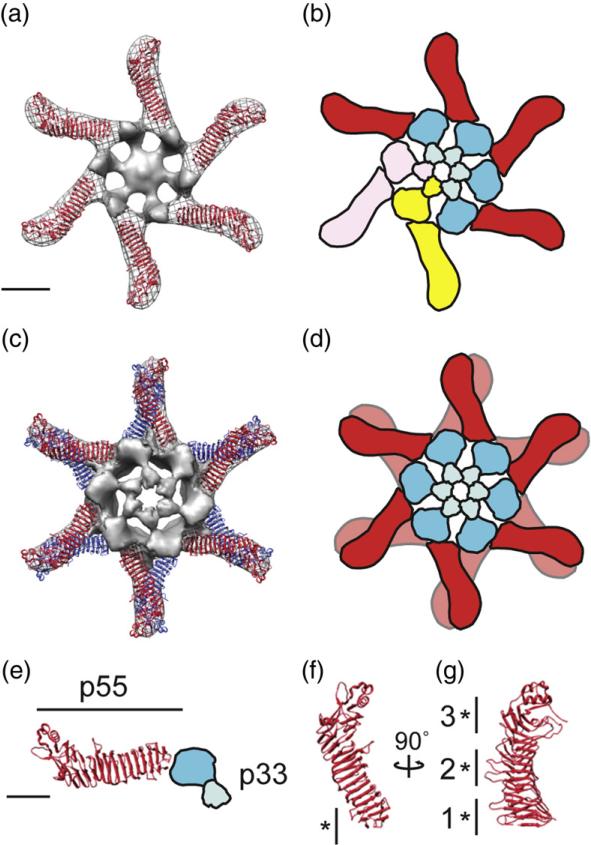
Structural model of the VacA oligomerization process. (a) The 2.4-Å crystal structure of p5533 fits into the straight “arms” of the EM map of a VacA hexamer. Subtracting the density of the p55 crystal structure from the EM map highlights p33 (gray, central density and spokes). (b) p88 oligomerizes into hexamers supported by intermolecular interactions between the N-terminal portions of p33 in adjacent protomers, as well as contacts between p33 and an adjacent p55 arm. Blue domains, p33; red domain, p55. Two p88 protomers are colored pink and yellow to show p88 protomer interactions. (c) The 2.4-Å crystal structure of p5533 fits into the straight “arms” of the EM map of a VacA dodecamer. For ease in viewing the model, the p33 density of only the well-organized side is shown. (d) Cartoon of dodecamer formation. Colors are the same as in (b). (a–d) The scale bar represents 5 nm. (e) The C-terminal p55 domain forms a straight arm with a kink at the end, while the N-terminal p33 domain consists of two globular densities connected by a thinner density (blue domains). (f and g) p55 crystal structure (2.4 Å) rotated 90° on the vertical axis. “*” marks regions of p55 involved in (f) hexamer interactions (residues 442–448) and (g) dodecamer and tetradecamer interactions. “1”, residues 395–404 and 421–435; “2”, residues 519–530 and 547–559; and “3”, residues 645–654 and 687–692. (e–g) The scale bar represents 2.5 nm.

