Fig. 5.
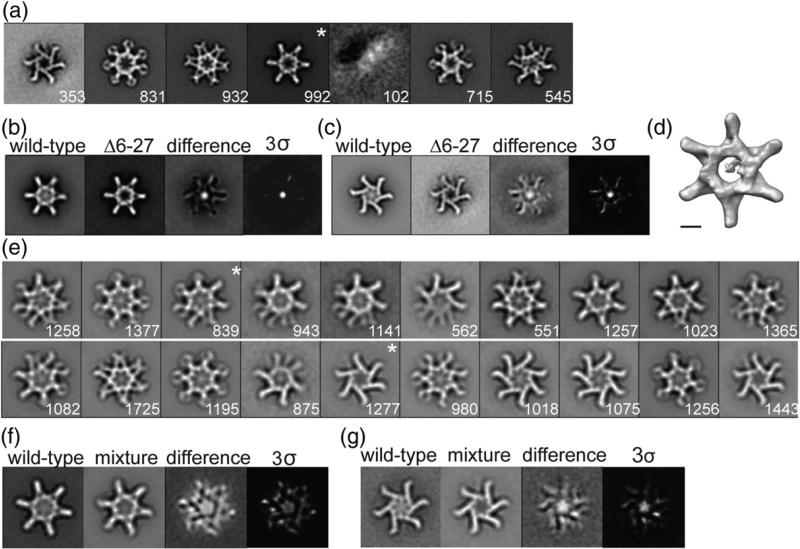
Characterization of VacAΔ6–27. (a) VacAΔ6–27 class averages obtained by reference-based alignment and classification. “*”, class shown as a 3D volume in (d). (b and c) Difference mapping between WT and similar VacAΔ6–27 class averages. Final panel shown at 3 σ threshold. (a–c) Side length of panels, 573 Å. (d) 3D structure of VacAΔ6–27 corresponding to the “*” average in (a). The structure has no applied symmetry. The scale bar represents 5 nm. (e) Class averages of VacA oligomers generated by mixing WT VacA and VacAΔ6–27. “*”, classes used in difference mapping shown in (f) and (g). (f and g) Difference mapping between WT VacA and mixture of WT:VacAΔ6–27 oligomers. The final panel shown at 3 σ threshold. (e–g) Side length of panels, 420 Å. The number of particles included in each class is shown in the bottom right corner.

