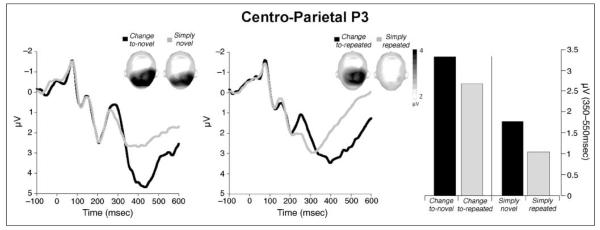
Figure 4.
Grand average ERP waveforms over centro-parietal sensors for novel pictures (left) and repeated pictures (middle) that signaled a significant change in the experimental context or did not. Topographic plots (top view) of the scalp voltage in the P3 window (350–550 msec) are included in each figure. Right panel: Mean P3 amplitude was larger for pictures that signaled a change compared with those that did not.

