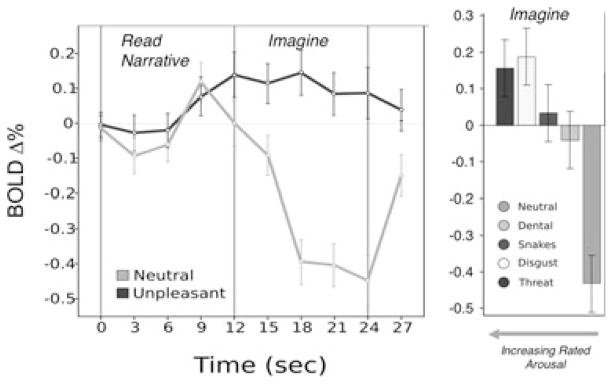
Figure 1.

On the left, mean event-related bold signal change (percent) in the amygdala during read (12 s) and imagery (12 s) of neutral and unpleasant narratives. On the right, average signal change in the amygdala during the imagery epoch for neutral and individual unpleasant content categories, arranged from right to left in order of increasing mean subjective arousal. Error bars represent 95% confidence intervals.[146] Adapted from Costa and colleagues.[32]
