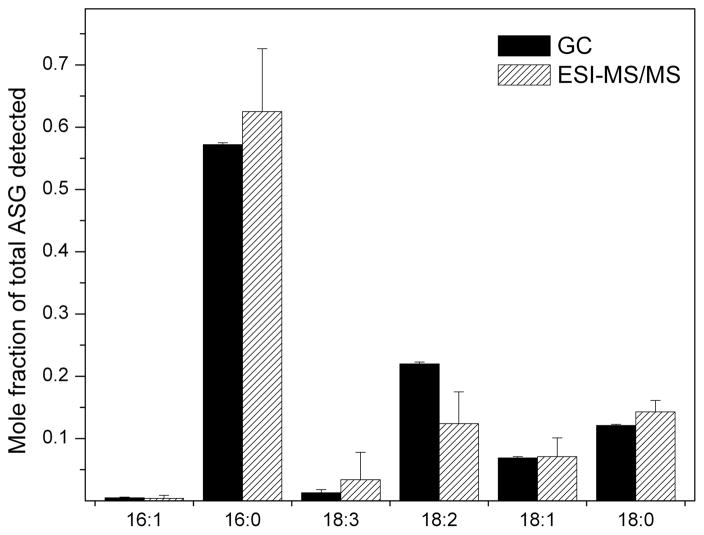
Figure 3.
Fatty acids of purified soybean ASG as a mole fraction of total detected fatty acids. Fatty acids were determined by GC-FID after formation of methyl esters, or the ASGs were analyzed intact by ESI-MS/MS. In the ESI-MS/MS data, the signals for various ASG molecular species with each fatty acid component were summed. Error bars represent standard deviations (sd) for GC (n = 3 for the number of independent samples) and ESI-MS/MS (n = 12 for the number of independent samples).

