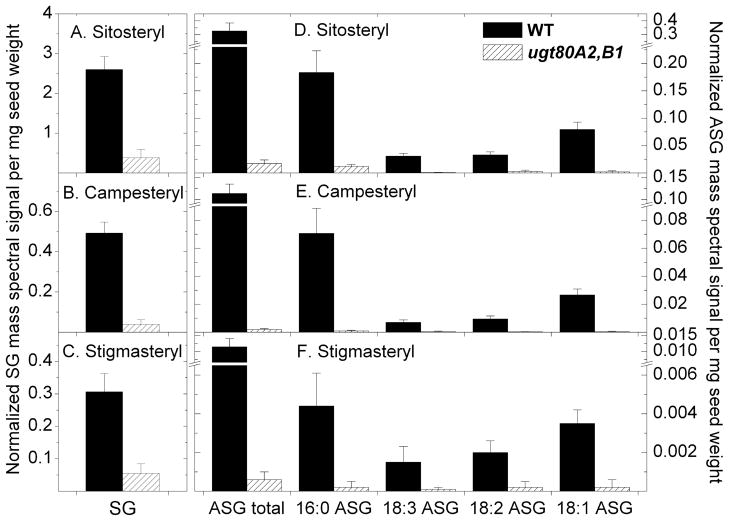
Figure 5.
SG and ASG levels are reduced in seeds from ugt80A2,B1 mutants of Arabidopsis. ESI-MS/MS was applied to analyze SGs and ASGs from seeds of wild-type (WT) (solid bars) and ugt80A2,B1 (stippled bars). Normalized mass spectral signals per mg seed weight are indicated for each compound: (A-C) SGs and (D-F) 16:0, 18:3, 18:2, and 18:1 ASGs. (A) SGs and (D) ASGs containing sitosterol. (B) SGs and (E) ASGs containing campesterol. (C) SGs and (F) ASGs containing stigmasterol. The total ASG amount was calculated by adding the normalized mass spectral signal of molecular lipid species of that group. Error bars represent standard deviations (sd) for n = 5 biological replicates.

