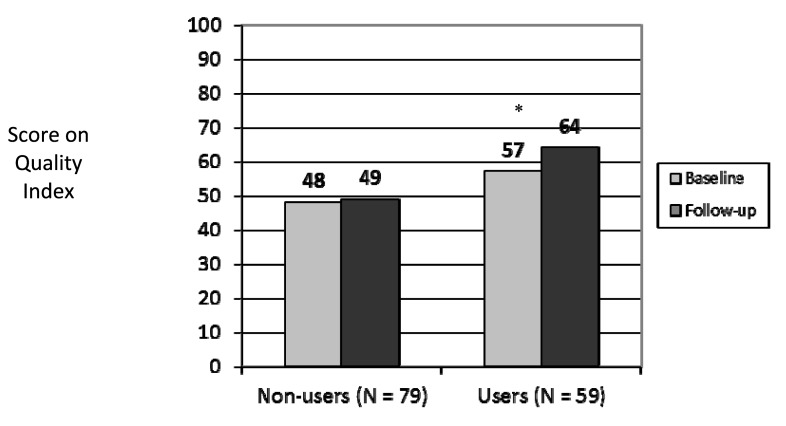
Fig. 1.
Average ambulatory quality of care for a composite of 15 measures, stratified by time and use of the portal. Comparisons were made with t-tests and generated the following p-values: at follow-up (black bars) difference between non-users and users (49% vs. 64%, p<0.0001), and within users (grey bar vs. black bar) baseline vs. followup (57% vs. 64%, p<0.001).

