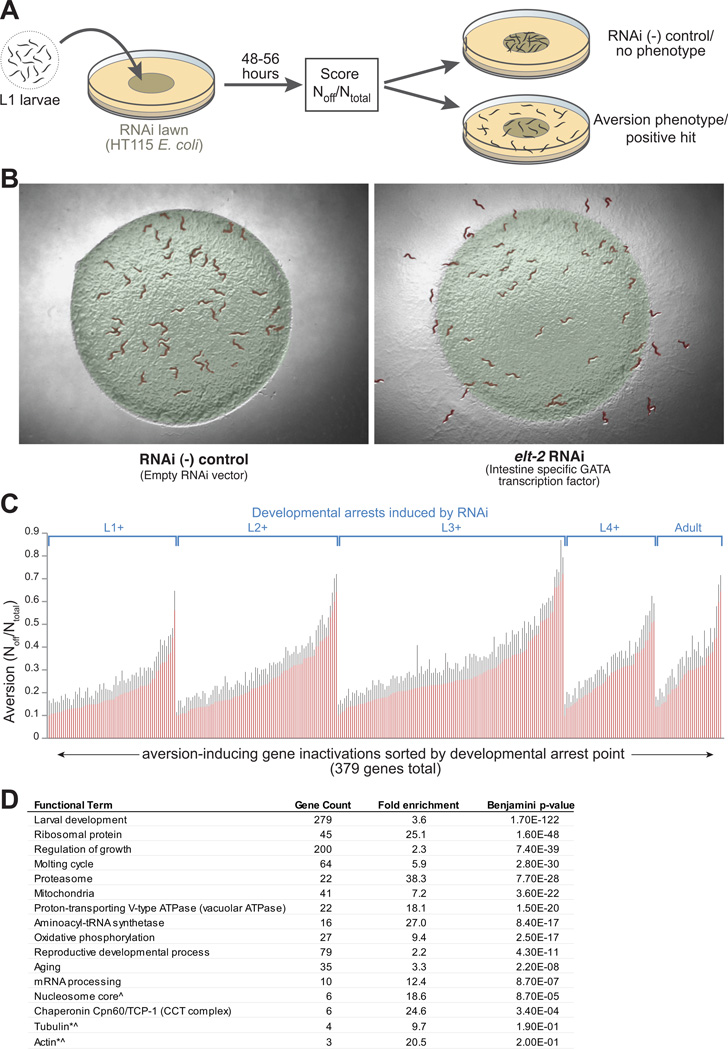
Figure 1. Inactivation of essential cellular pathways stimulates microbial avoidance behavior.
(A) Schematic of RNAi microbial aversion assay.
(B) Example of control and aversion phenotypes after 48hr of growth on elt-2 or RNAi control bacteria. elt-2 encodes a transcription factor necessary for gut development and homeostasis.
(C) Developmental stage- and rank-ordered aversion levels +SEM for 379 gene inactivations (of 4,062 screened) exhibiting aversion ≥10% off bacteria at 48-58hr of growth on RNAi bacteria.
(D) DAVID bioinformatic analysis of aversion genes showing enrichment for specific functional categories. *enriched gene classes that were not statistically significant due to small N. ^high intra-class homology that could produce an elevated false positive rate due to off-target RNAi effects.

