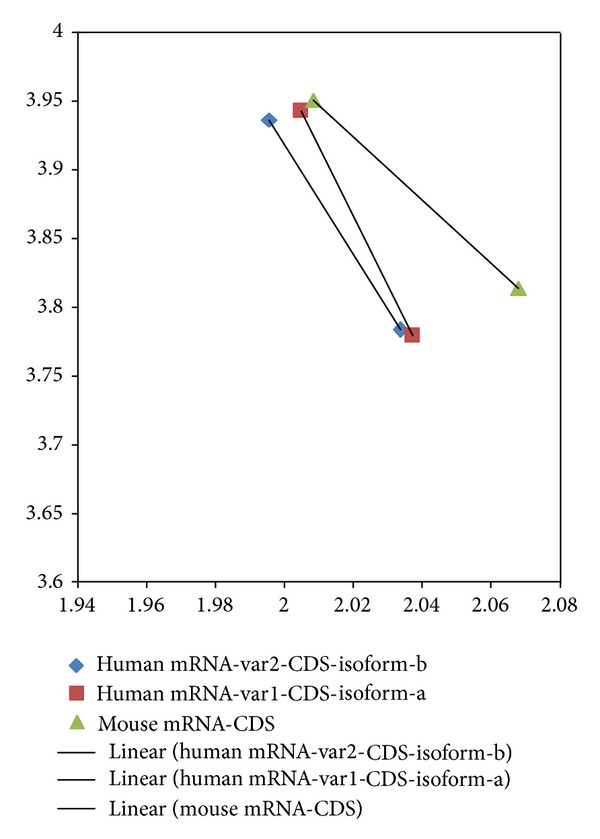
Figure 4.

Displacement vector from mRNA to CDS for human ID1, and mouse ID1. The y-axis represents di-nucleotide entropy in bits per symbol and x-axis presents the fractal dimension. The separation or distance is shown as the length of the displayed line and the direction is from mRNA coordinates (upper diamond, upper square and upper triangle) to CDS coordinates (lower diamond, lower square and lower triangle).
