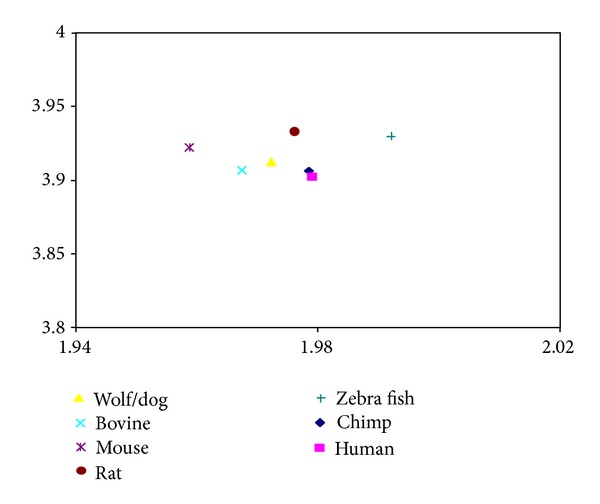
Figure 6.

The protein coding CDS 2D map of the studied p53 sequences. The y-axis represents di-nucleotide entropy in bits per symbol, and x-axis presents the fractal dimension. The studied sequences included wolf/dog (triangle), bovine (cross), mouse (star), rat (circle), zebra fish (plus), chimp (diamond), and human (square).
