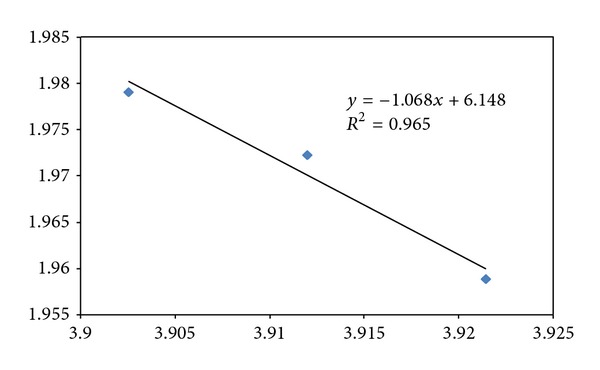
Figure 7.

Entropy-fractal dimension for p53 CDS. The x-axis represents di-nucleotide entropy in bits per symbol, and y-axis presents the fractal dimension. Human has the highest fractal dimension, followed by wolf/dog, and mouse with the lowest fractal dimension.
