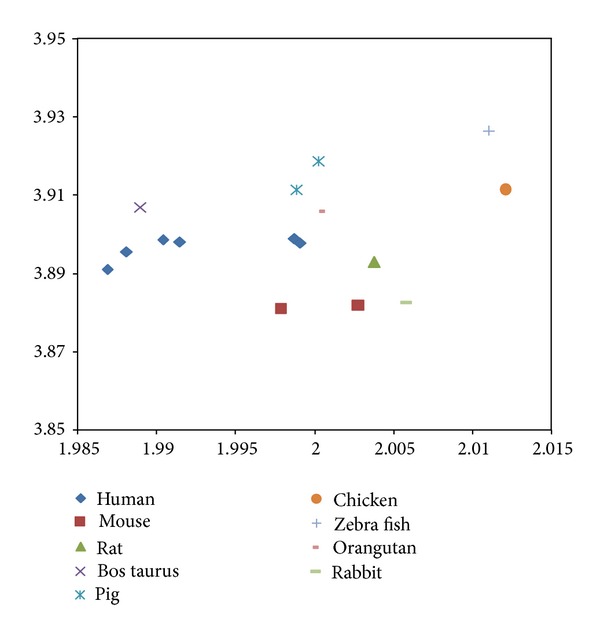
Figure 8.

Entropy-fractal dimension for PKM2 CDS. The y-axis represents di-nucleotide entropy in bits per symbol, and x-axis presents the fractal dimension. The PKM2 of human (diamond, with 7 variants, gene no. 5315), mouse (square, with 2 variants, gene no. 18746), rat (triangle, gene no. 25630), bos Taurus (cross, gene no. 512571), pig (star, gene no. 100158154), chicken (circle, gene no. 396456), zebrafish (plus, gene no. 335817), orangutan (shorter bar, gene no. 100174114), and rabbit (longer bar, gene no. 100008676) are displayed.
