Figure 1.

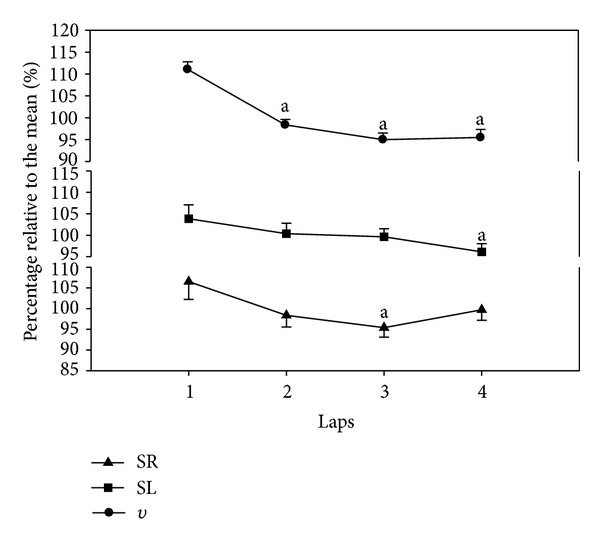
Mean (SE) values expressed as a percentage of the mean value for the 200 m front crawl for velocity (v), stroke length (SL), and stroke rate (SR) are plotted as a function of the 50 m laps. aSignificantly different from the 1st lap.

Mean (SE) values expressed as a percentage of the mean value for the 200 m front crawl for velocity (v), stroke length (SL), and stroke rate (SR) are plotted as a function of the 50 m laps. aSignificantly different from the 1st lap.