
Figure 4.
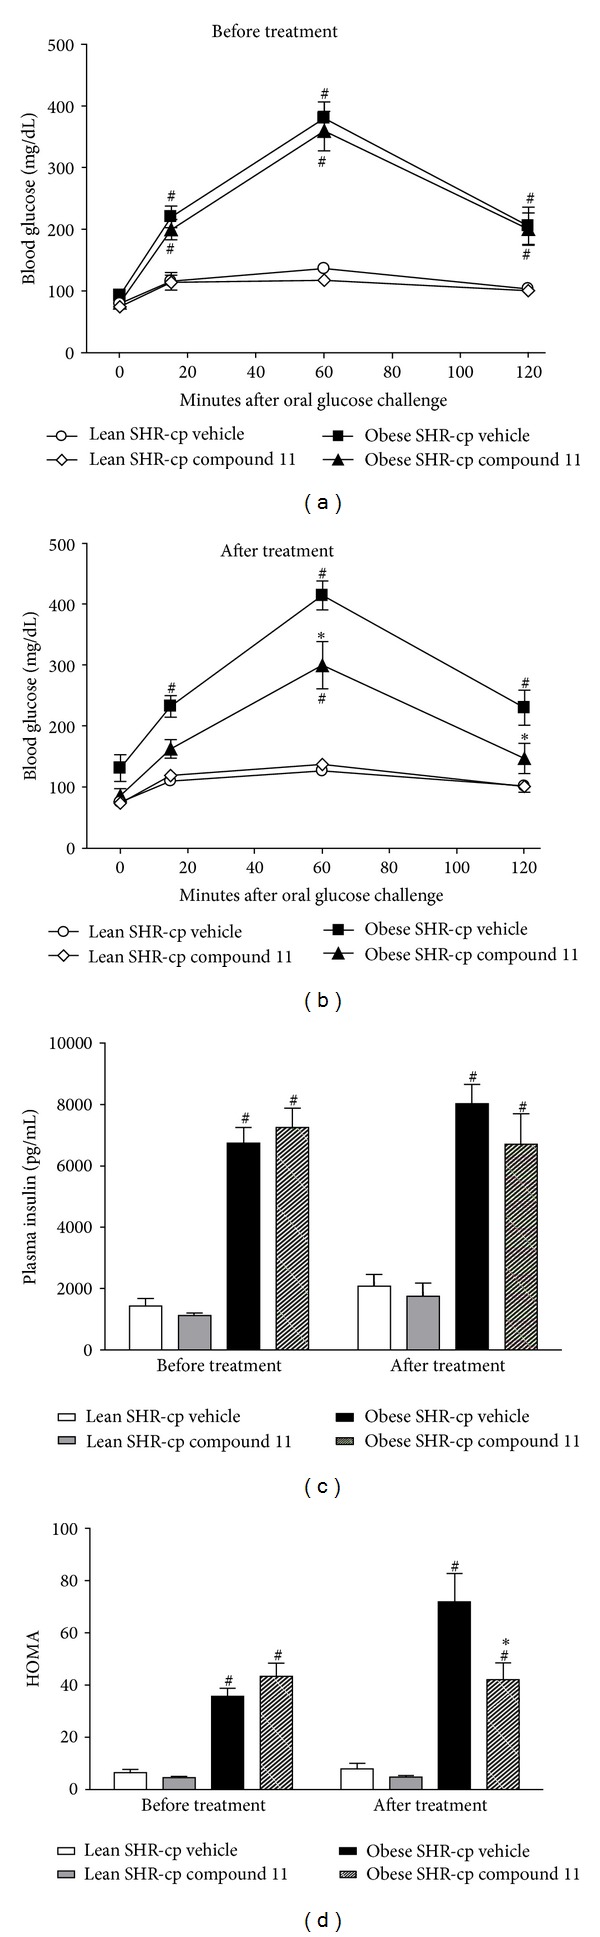
Indices of glucose tolerance and insulin resistance in obese and lean SHR-cp before and after 4 weeks of vehicle or compound 11 administration (10 mg/kg/d). (a) represents the blood glucose concentrations in all rats during oral glucose tolerance testing before vehicle or compound 11 administration. (b) represents the blood glucose concentrations in all rats during oral glucose tolerance testing after chronic vehicle or compound 11 administration. Oral glucose load was administered after fasting blood glucose was measured at t = 0 minutes. (c) is the plasma insulin concentration in all groups of rats before and after chronic vehicle or compound 11 treatment. (d) is the homeostasis model assessment index (HOMA) in all groups of rats before and after chronic vehicle or compound 11 treatment. *P < 0.05 compared to obese SHR-cp vehicle. # P < 0.05 compared to lean SHR-cp.