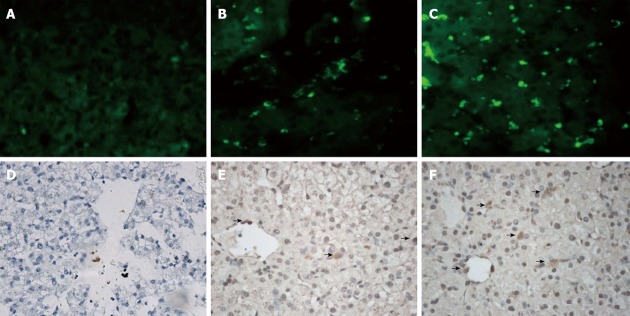
Figure 5.

Fluorescence and anti-green fluorescence protein stained images of liver tissue 2 wk after surgery. A, B and C are fluorescence images of Group B, Group C and Group D, respectively; D, E and F are anti-green fluorescence protein immunohistochemical images of Group B, Group C and Group D, respectively. More cells expressing green fluorescence protein were seen in Group D (arrow). Magnification, ×400.
