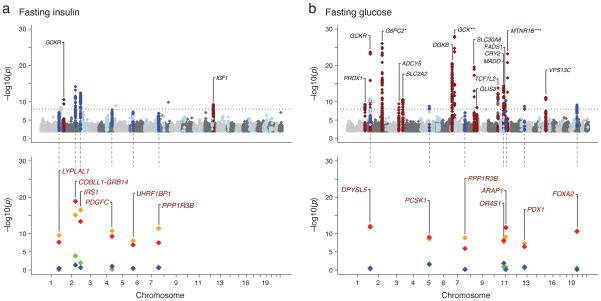
Figure 1.
Genome-wide plots of the discovery joint meta-analysis (JMA) for fasting insulin (1a top) and fasting glucose (1b top): 17 loci with known associations were observed (red) and 50 loci were taken to the follow-up analysis (light and dark blue). Of these, 12 reached genome-wide significance in the combined discovery and follow-up JMA (dark blue). The P values of these 12 loci from the models fit in the combined discovery and follow-up analyses are presented in Figure 1a (bottom) for fasting insulin and 1b (bottom) for fasting glucose: JMA (red), main effects adjusting for BMI (orange), interaction with continuous BMI (green) and interaction with dichotomous BMI (blue). * G6PC2 JMA P value: 1.7 × 10−113, ** GCK JMA P value: 8.3 ×10−56, *** MTNR1B JMA P value: 4.38 × 10−105.

