
Figure 13.
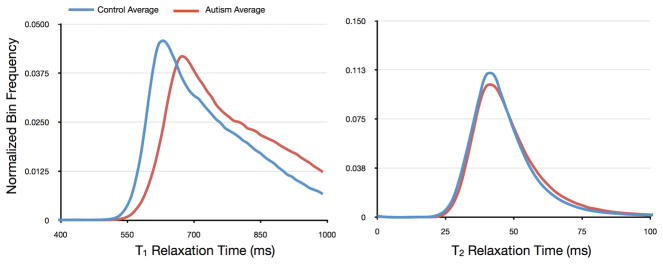
Tract-specific comparison of T1 and T2 in the right and left superior longitudinal fasciculi (shown as the green volume rendering superimposed on the anatomical images) in healthy young adults and those with autism. Histograms of values along these tracts demonstrate substantive alteration in T1 and T2.