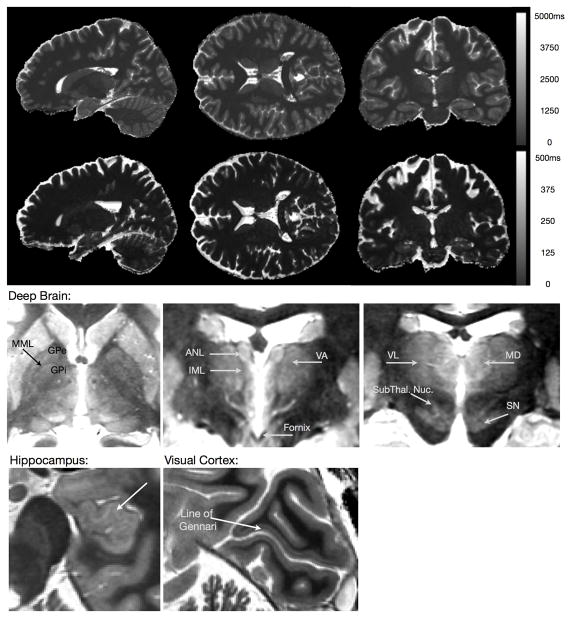
Figure 3.
(TOP) Representative quantitative T1 and T2 maps of the brain acquired using the DESPOT1 & DESPOT2 methods with incorporated B0 and B1 field corrections at 3 Tesla. Total acquisition time was 12 minutes for the whole brain (1×1×1)mm3 resolution maps. (BOTTOM) Axial, sagittal, and coronal slices through a high resolution T1 map, demonstrating the image contrast quantitative imaging can provide.

