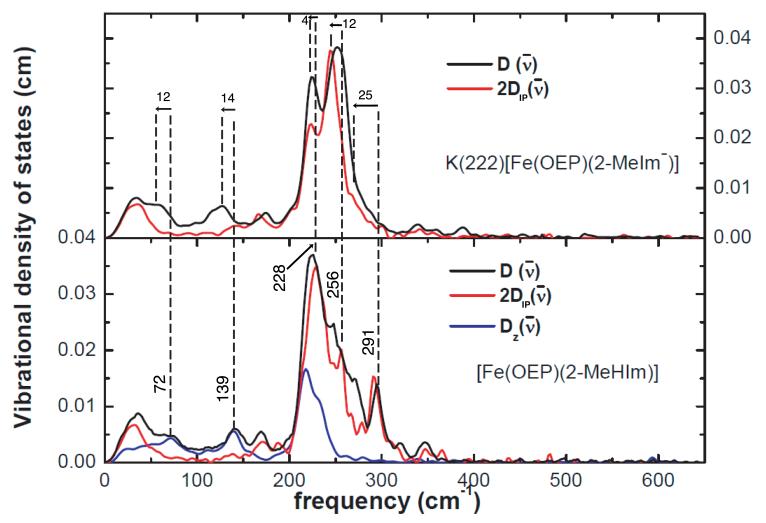
Figure 5.
Comparison of the vibrational spectra of [Fe(OEP)(2-MeHIm)] and [K(222)][Fe(OEP)(2-MeIm−)]. The dashed lines and arrows display the shifts in selected vibrations. We have entered along the vertical dashed lines, the value of the observed frequency (in cm−1) for the imidazole species. Note that values of observed frequencies are given in Table 2 along with the mode assignments. The values of the frequency shift, along with an arrowhead showing the direction of the shift, is entered for each correlated pair.

