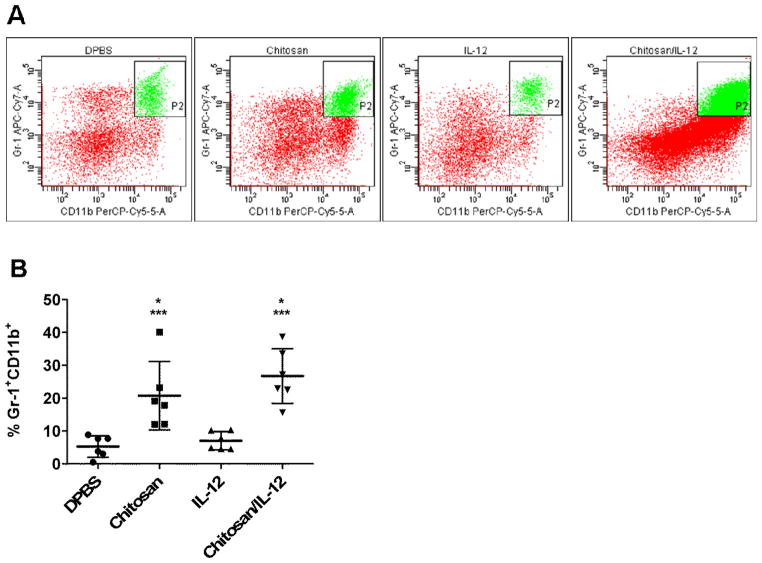
Fig. 5.
Gr-1+CD11b+ cells in tumors of mice receiving i.t. injections. MC38 tumors were processed as in Fig. 4. A, representative dot plots showing increases in Gr-1+CD11b+ cells in tumors treated with chitosan alone or chitosan/IL-12. B, percentages of Gr-1+CD11b+ cells for individual mice as well as mean ± standard deviation. *P<0.05 vs. DPBS; *** P<0.05 vs. IL-12.

