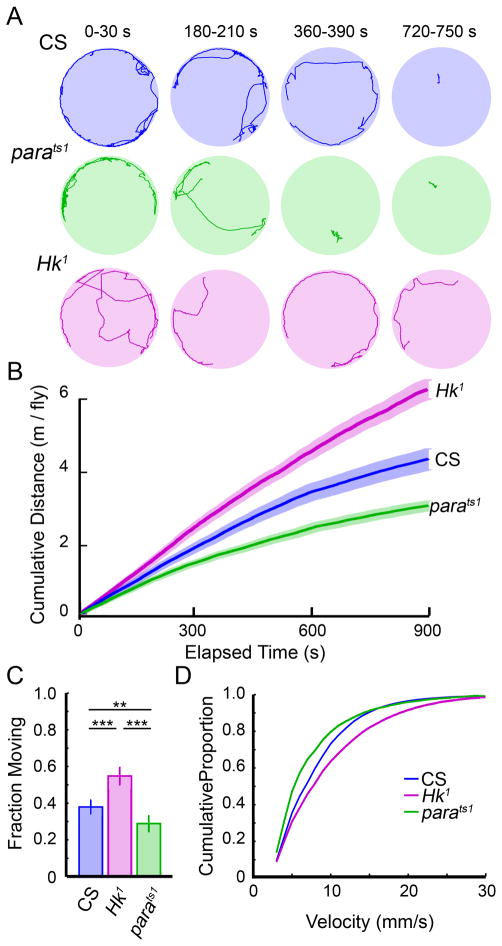
Figure 2. Locomotion in two Drosophila ion channel mutants: parats1, and Hk1.
(A) Four male flies were placed in an arena and tracked for 15 minutes. Shown are sample tracks from individual flies at four 30 s intervals. (B) The mean cumulative distance traveled for individuals from each of the three genotypes. Shaded regions represent S.E.M. Hk1 and parats1 showed significantly altered patterns of locomotion with increased and decreased total distances traveled respectively when compared to CS (p < 0.01, Mann-Whitney U Test, n=40, 32, 24 flies for CS, Hk1 and parats1 respectively) (C) The proportion of time individuals were moving, defined to be when their velocity was <3 mm/s. Error bars represent standard error of proportion (** p < 0.01, *** p < 0.001, Mann-Whitney U Test). (D) The cumulative distribution of fly velocities indicate the proportion of time a fly is moving (velocity > 3 mm/s), but is traveling slower than the corresponding velocity. The velocity profiles for CS, Hk1, and parats1 were not significantly different, (Kolmogorov-Smirnov test, p > 0.05).

