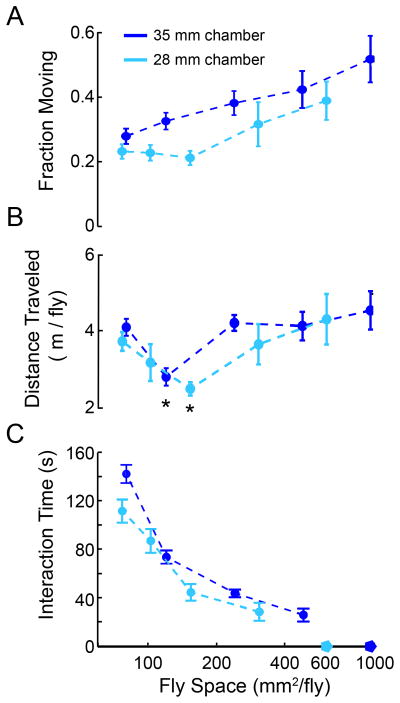
Figure 3. Fly activity levels depend on available “social space”.
(A) A varying number of CS flies were introduced to each chamber (1, 2, 4, 8, 12 flies for 35 mm chamber, dark blue line; 1, 2, 4, 6, 8 flies for 28 mm chamber, light blue line), and their activity was recorded for 15 minutes. Show are the fraction of time that the flies were moving (velocity > 3 mm/s) during the video (error bars represent standard error of proportion, n= 12, 18, 40, 72, 72 flies respectively for 35 mm chamber 1, 2, 4, 8 and 12 fly videos; n=16, 10, 56, 54, 64 flies respectively for 28 mm chamber 1, 2, 4, 6 and 8 fly videos ). (B). Plotted are the average distance traveled versus the per-fly surface area was plotted. Error bars represent S.E.M. (*p<0.05, ANOVA, Tukey Post Hoc HSD). (C) The amount of time an individual fly spends interacting with other flies (within 2 mm of another fly) during the video. (mean ± SEM). It should be noted that when one fly is in an arena (denoted by pentagrams), no interactions occur.

