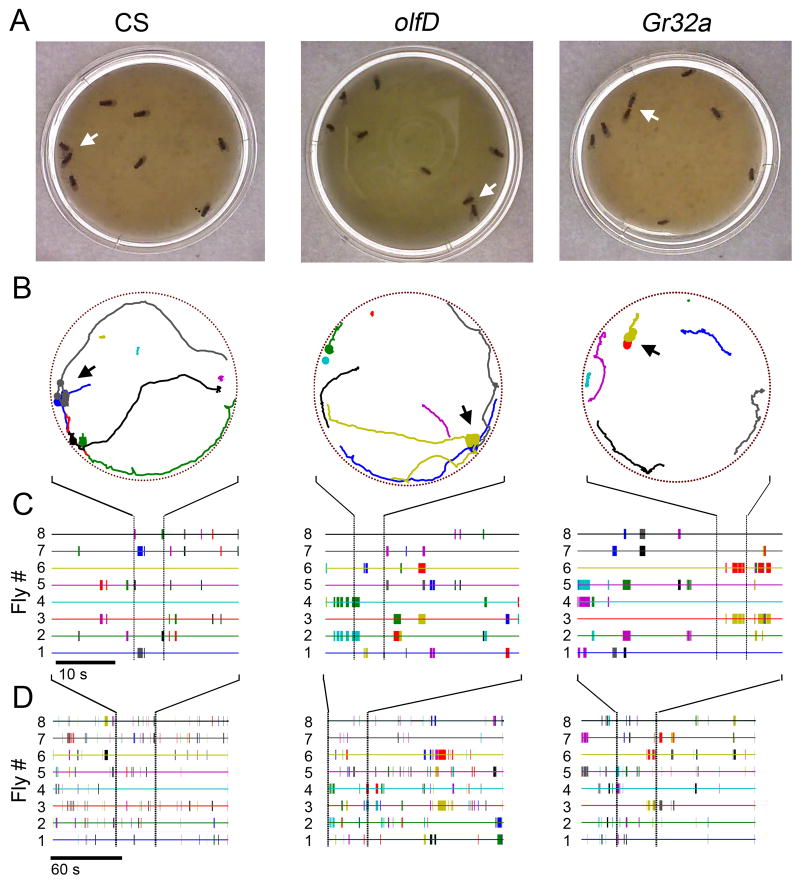
Figure 4. Interactions among male chemosensory mutants.
(A) Sample frames of interactions among eight individuals of CS, olfD, and Gr32a genotype. White arrows indicate ‘tapping,’ ‘tapping’ and ‘head-butting’, respectively in the frames. (B) Tracks of locomotor activity in the 5 seconds around the time of the events in (A). The width of a fly’s track is expanded during a period of interaction, and the arrows indicate the interactions shown in (A). Tracks of individual flies are identified with different colors. (C) Representative pair-wise ‘interactograms’ over a 30 s period for the three genotypes. History of interactions for each individual are identified with the same color of the track in (B) and interacting events are marked with hatches of different colors to identify the interacting partner. (D) Expanded period of interactogram (at a compressed resolution to cover 150 s) of the corresponding panels in (C).

