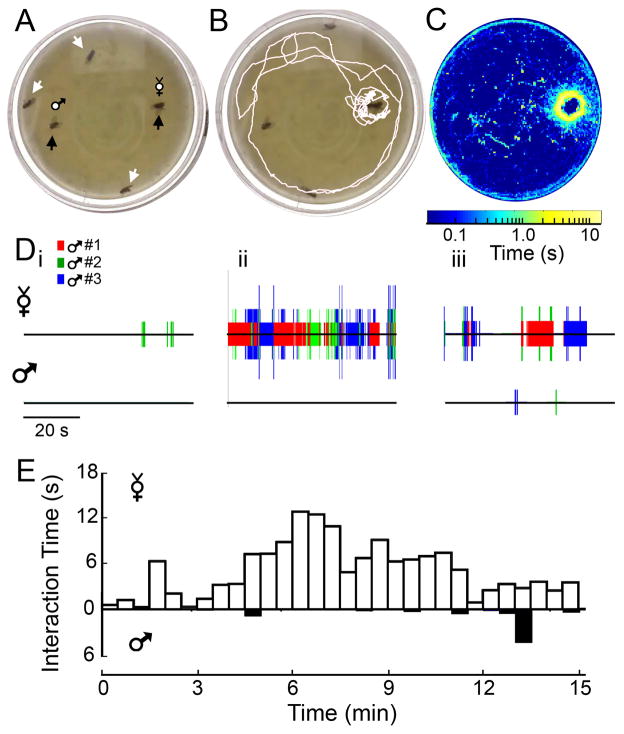
Figure 5. The ‘target-preference’ assay.
(A) Sample frame from the preference assay. Three male flies (white arrows) were introduced to a chamber with two pinned and decapitated ‘targets’ (virgin female on right, male on left, black arrows). (B) Sample 30 s track of a male fly. (C) A 15-min log-place map of fly locations the sample video. (D) 1-min interactograms for each target at (i) 3-min, (ii) 6-min, and (iii) 12-min in the video. Colors indicate the identity of interacting male, and ticks are stacked during periods when multiple males interact with the target. (E) Plot of the average time an individual fly spends interacting with a target during 30-s intervals through the 15-min videos (n = 15 flies).

