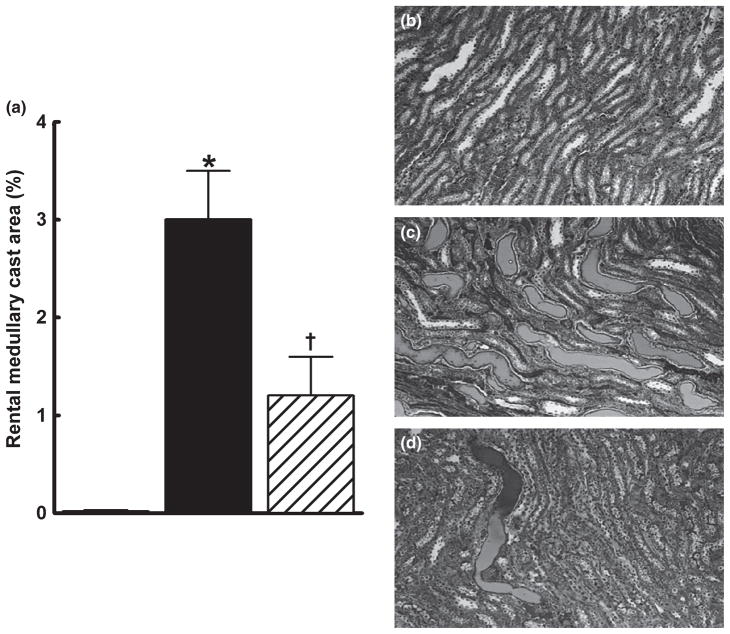
Fig. 5.
Kidney medullary cast formation in control (□), sorafenib-treated (■) and sorafenib + captopril-treated (▨) rats after 4 weeks treatment. The number of tubules containing proteinaceous casts was determined at × 100 magnification using Masson’s trichrome staining. The percentage area positive for casts was calculated from the mean of five medullary fields (at × 100) for each animal. Data are the mean ± SEM (n = 5–6). *P < 0.05 compared with vehicle control; †P < 0.05 compared with the sorafenib-treated group (one-way ANOVA followed by Tukey’s post hoc test). (b–d) Representative photomicrographs from rats in the vehicle- (b), sorafenib- (c) and sorafenib + captopril (d)-treated groups.

