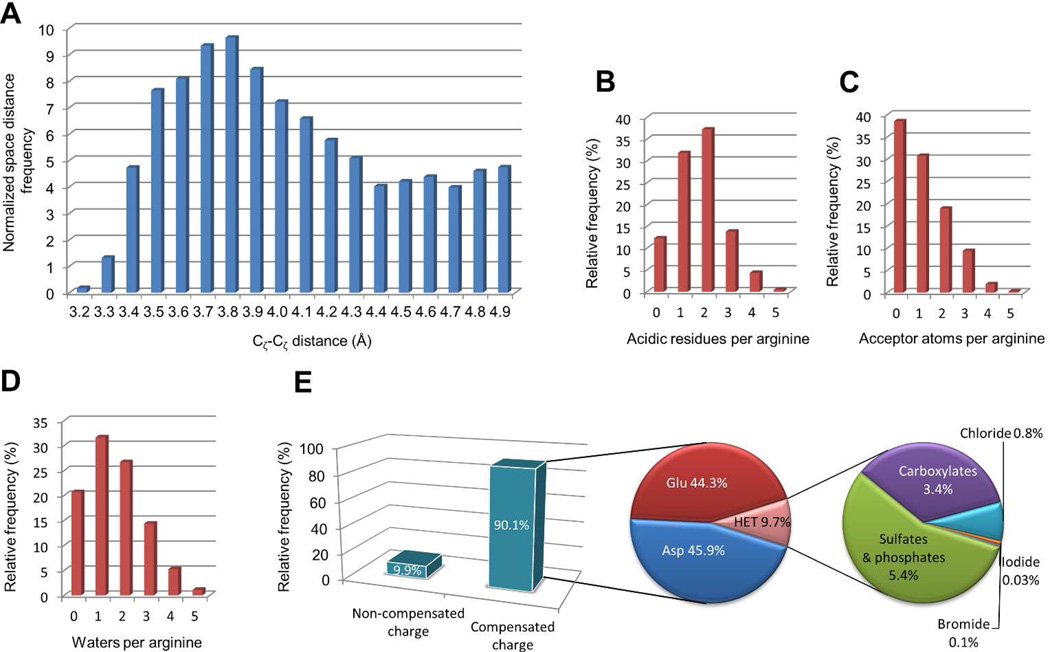
Figure 4.
Property distribution of a subset of 13,218 high quality, density-supported, arginine clusters from the PDB database. A) For each arginine, the Cζ-Cζ distance to the closest arginine residue was calculated, and the pairs were grouped into distance bins. The frequency was normalized to account for the cubic growth of spherical volume. The number of arginines that fall into each bin was divided by the square of the distance. Counts for the number of aspartic and glutamic acid residues within a 6 Å distance cutoff (B), the number of hydrogen bond acceptor atoms (C) and crystallographic water molecules (D) within a 3.35 Å distance cutoff are provided. The inset E shows the fraction of arginines surrounded by negatively charged counter ions. Common counter ions are indicated.

