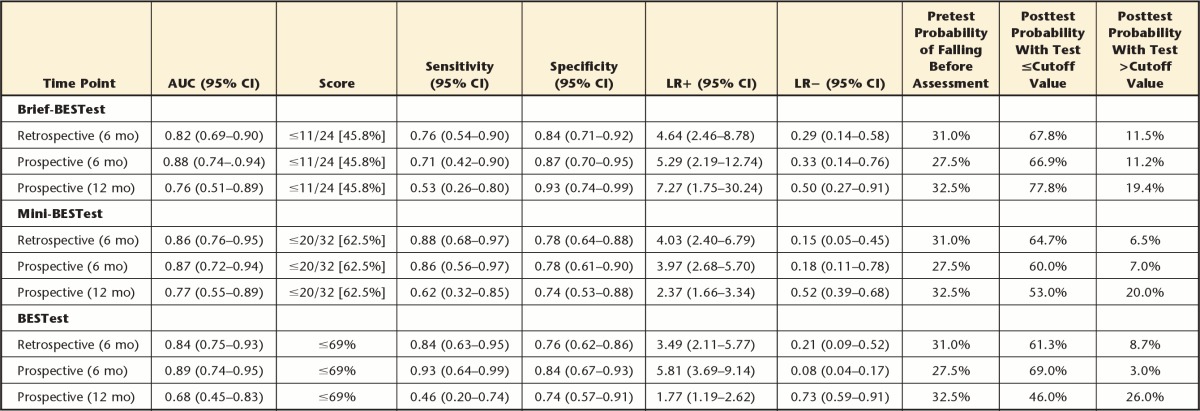
Table 3.
Predictive Values for the Brief-BESTest, Mini-BESTest, and BESTest at Each Time Pointa

Values are mean (SD). Values inside brackets indicate percentage score determined from raw score to ease comparison to the BESTest. AUC=area under the curve, 95% CI=95% confidence interval, LR+=positive likelihood ratio, LR−=negative likelihood ratio.
