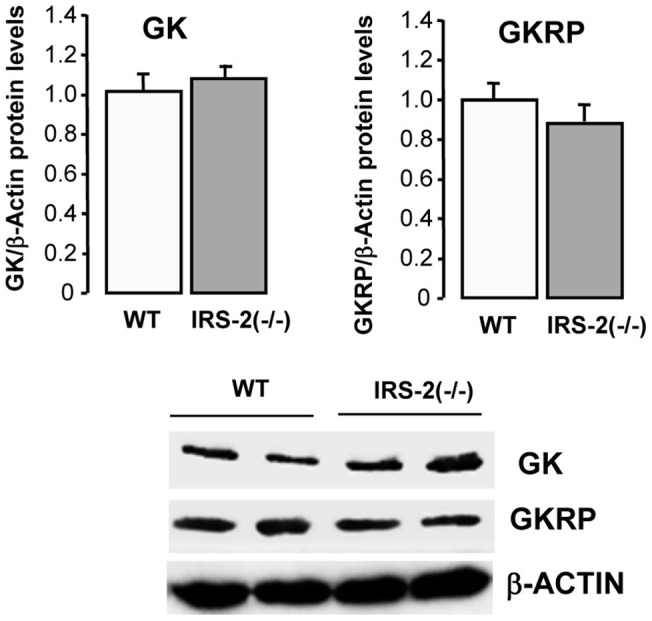
Figure 4. Analysis of hypothalamic GK and GKRP protein expression in IRS-2(−/−) and wild type mice.

Total protein levels of GK and GKRP in hypothalamus from IRS-2(−/−) and their wild type mice. The bars represent means ± SE of the densitometric values normalized by β-actin (n = 3 animals per group). The values obtained in wild type mice were considered as 1. Representative Western blots images are shown.
