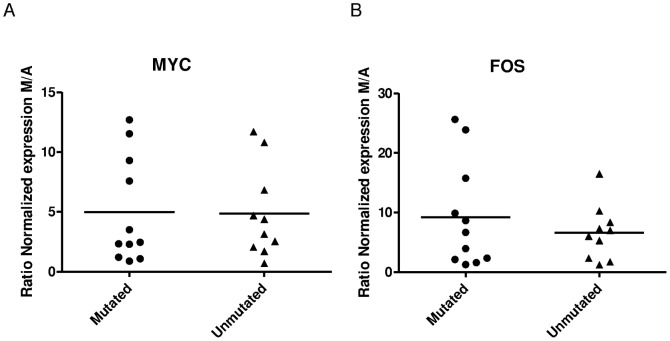
Figure 1. BCR stimulation of both IGHV mutated and IGHV unmutated CLL cells induces gene expression.
Expression of MYC (A) and FOS (B) in CLL cells stimulated with anti-IgA or anti-IgM beads for 24 hours (MYC) or 3 hours (FOS). Scatter plots show normalized mRNA expression for IGHV mutated (M, • ; N = 11) and IGHV unmutated cases (U, ▴; N = 10), horizontal line represent average value. Significant induction of both MYC and FOS (p<0.05), however not significantly different between IGHV mutated and IGHV unmutated cases. (C) Kinetics of expression of ELK1, NFAT5, FOS, DUSP2, EGR1 and MYC. Scatter plots show normalized mRNA expression for IGHV mutated (M, • ; N = 4) and IGHV unmutated cases (U, ▴; N = 4), horizontal lines represent average values. Significant differences are indicated (*) (p<0.05).

