
Figure 2. BCR stimulation induces an expression profile enriched for MYC induced genes.
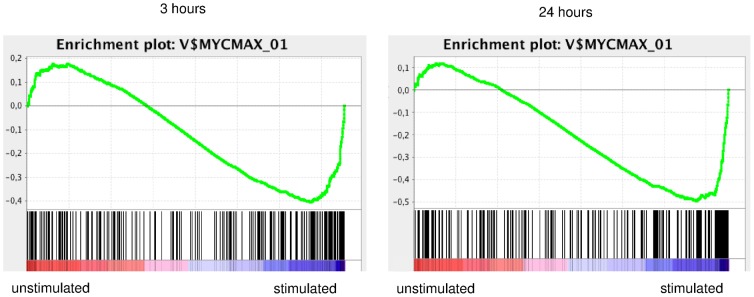
Figure shows Gene Set Enrichment Analysis enrichment plot of MYCMAX_01 gene set from Transcription Factor Targets collection (version 3.1) of data obtained after 3 hours or 24 hours of stimulation as indicated. Bottom shows location of the genes in MYCMAX_01 set in the ranked list of differentially expressed genes: highest in unstimulated samples left (red zone) to highest in stimulated samples right (blue zone)). Upper part shows profile the running enrichment score (green line), showing maximum enrichment score (negative value) in stimulated samples. For both time points, FDR q value was below 0.01.