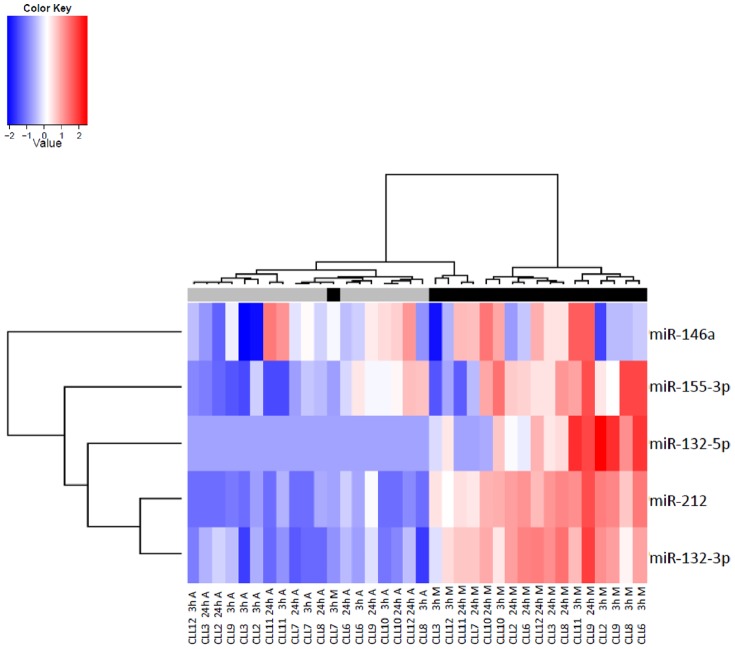
Figure 3. A selected set of miR characterizes BCR stimulated CLL cells.
Heat-map shows unsupervised clustering of samples (anti-IgM stimulated black tag, control IgA stimulated grey tag) according to expression of hsa-miR-146a, hsa-miR-155-3p, hsa-miR-132-5p, hsa-miR212 and hsa-miR-132-3p. Code from blue (−2 log2 normalized expression) to red (+2 log2 normalized expression) indicates miR expression levels.

