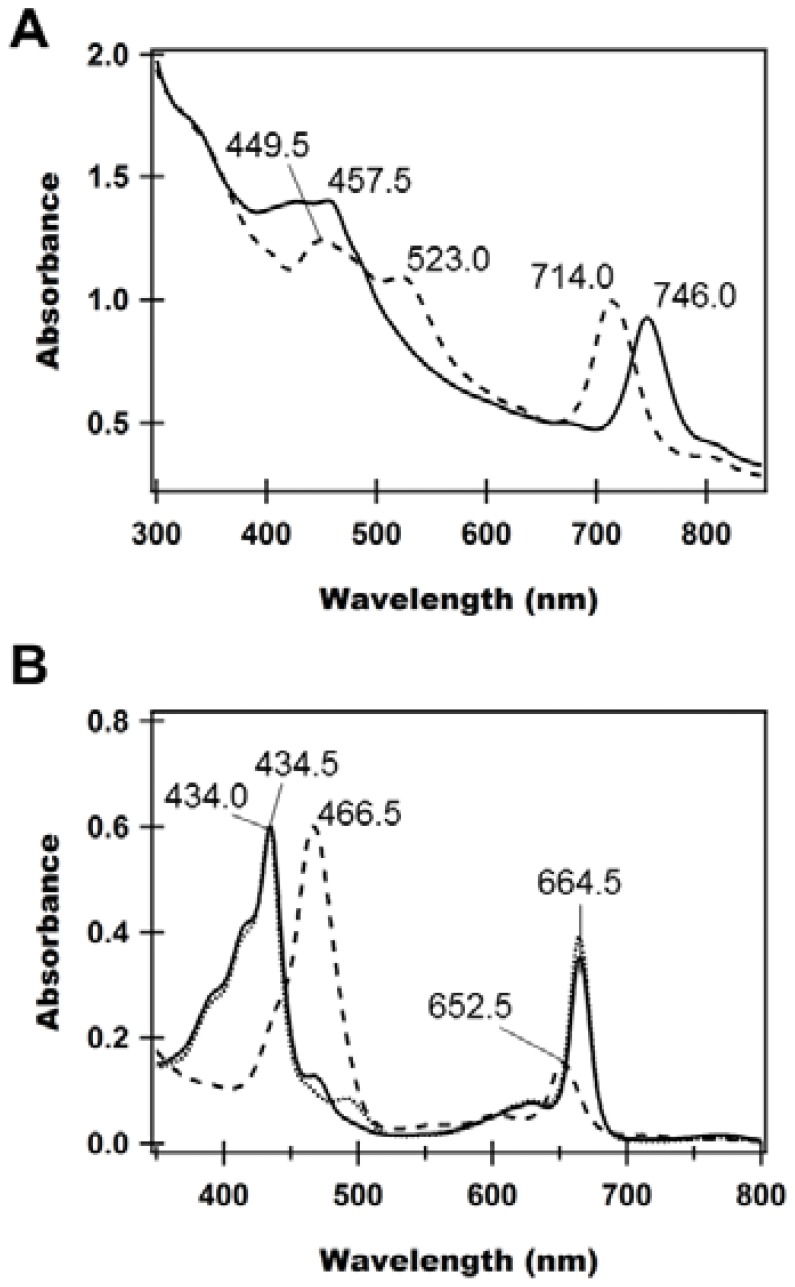
Figure 3. UV-Vis-NIR absorption spectra of whole cells (A) and extracted pigments (B) of the Cba. limnaeum wild type (broken lines) and bciD mutant (solid lines); measured using a Hitachi UV-2550 (Shimadzu, Japan) spectrophotometer.
(A) Wild type and mutant cells in stationary phase were collected and suspended in 50 mM Tris-HCl (pH 7.8) containing 150 mM NaCl; normalized at 660 nm. (B) Pigments were extracted with a mixture of acetone and methanol (7∶2, v/v), and used for the measurements; normalized at Soret maxima. The dotted line shows absorption spectrum of pigments from Cba. tepidum as control for BChl c.

