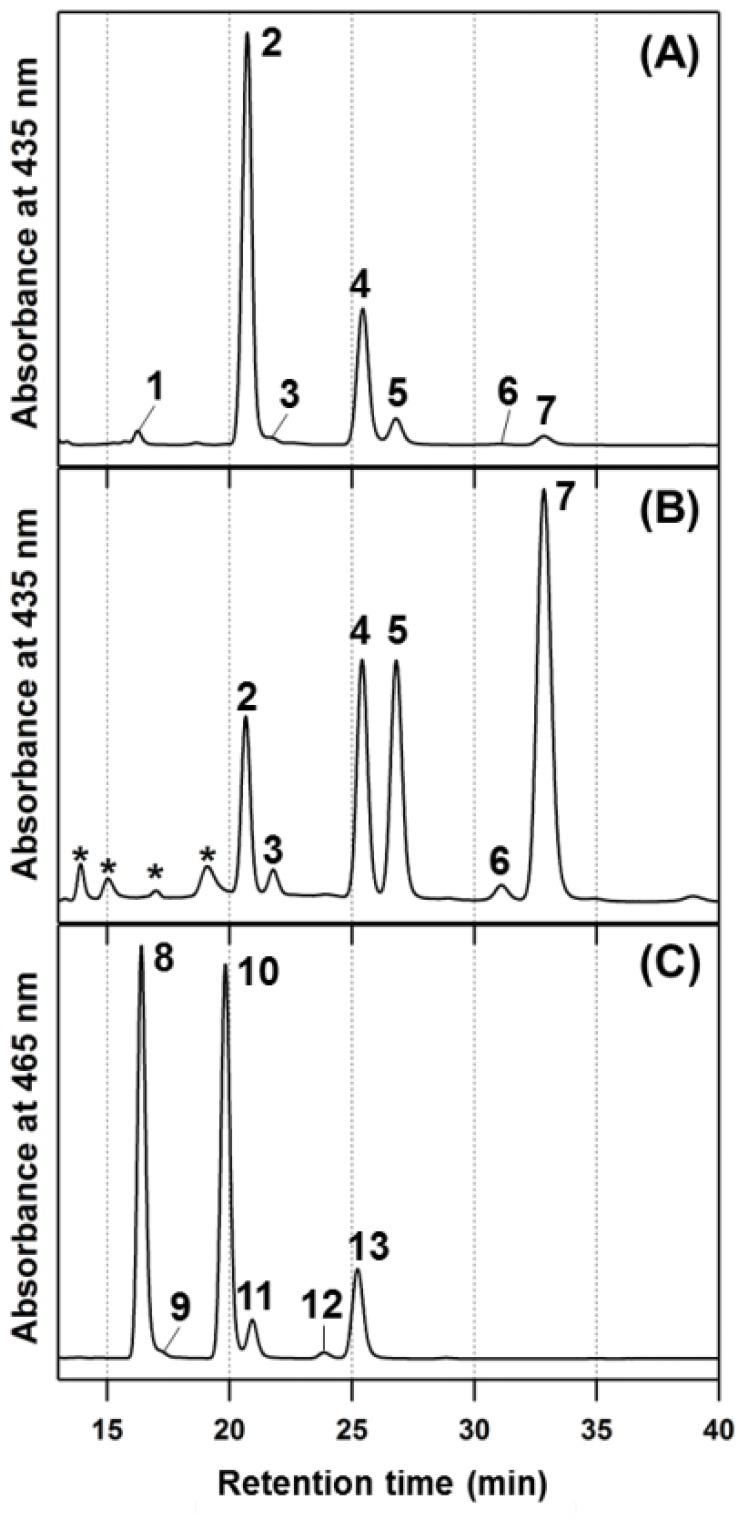
Figure 4. HPLC elution profiles of extracted pigments from GSB.
(A) From Cba. tepidum as control for BChl c, recorded at 435 nm. (B) From Cba. limnaeum bciD mutant recorded at 435 nm. (C) From Cba. limnaeum wild type recorded at 465 nm. Peak 1, R[E,M]BChl c; peak 2, R[E,E]BChl c; peak 3, S[E,E]BChl c; peak 4, R[P,E]BChl c; peak 5, S[P,E]BChl c; peak 6, R[I,E]BChl c; peak 7, S[I,E]BChl c; peak 8, R[E,E]BChl e; peak 9, S[E,E]BChl e; peak 10, R[P,E]BChl e; peak 11, S[P,E]BChl e; peak 12, R[I,E]BChl e; peak 13, S[I,E]BChl e. Peaks at the asterisk in panel (B) indicate impurities produced during handling of the sample.

