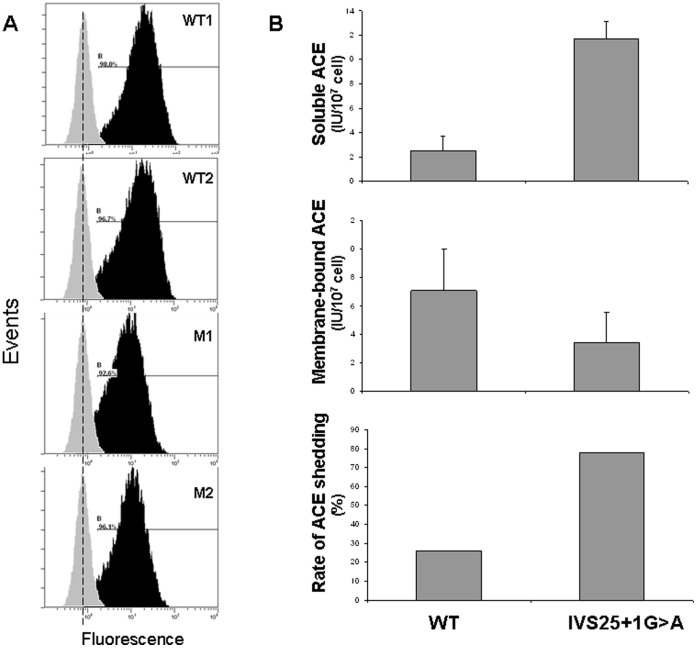
Figure 3. Cell surface expression and shedding of mutant ACE.
Panel A. FACS analysis of immature dendritic cells with anti-ACE antibodies. Cells were stained with mAb i2H5 (black histogram) or with control mouse IgG (grey histogram). Figures correspond to values of median fluorescence intensity. Affected family members with the IVS25+1G>A mutation were shown to express a ≈50% lower level of ACE on their cell surface compared to non-affected family members. Panel B. ACE shedding into the medium. ACE activity in the medium (“Soluble ACE”) and membrane-bound ACE activity were determined on immature dendritic cells from 2 subjects harboring the IVS25+1G>A mutation (II.7 and III.1) and 2 controls (II.6 and I.9) from the first pedigree. Their ratio represents the rate of ACE shedding into the medium. In agreement with the findings of the FACS analysis, shedding was ≈3 times larger in the individuals with the mutated ACE. WT: wild-type subjects.

