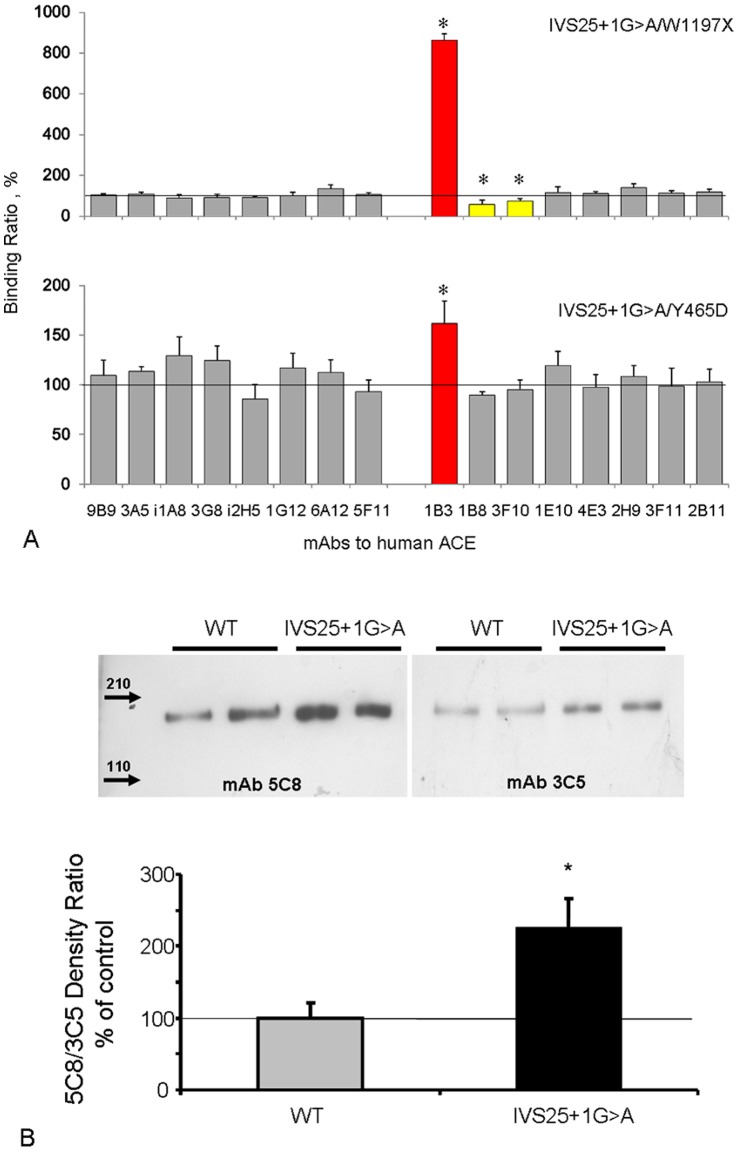
Figure 4. Analysis of the mutant ACE protein.
Panel A. Conformational fingerprinting of mutant ACEs with a set of mAbs to ACE. Values were normalized versus individuals with the Trp1197Stop mutation or the Tyr465Asp mutation, since their blood contained similarly elevated ACE levels and allowed measurements at the same dilution. *P<0.05 vs. 100%. Panel B., Western blot analysis of wild-type (WT) and mutant ACEs. Insert, 5C8/3C5 density ratio. *P<0.05 vs. WT.

