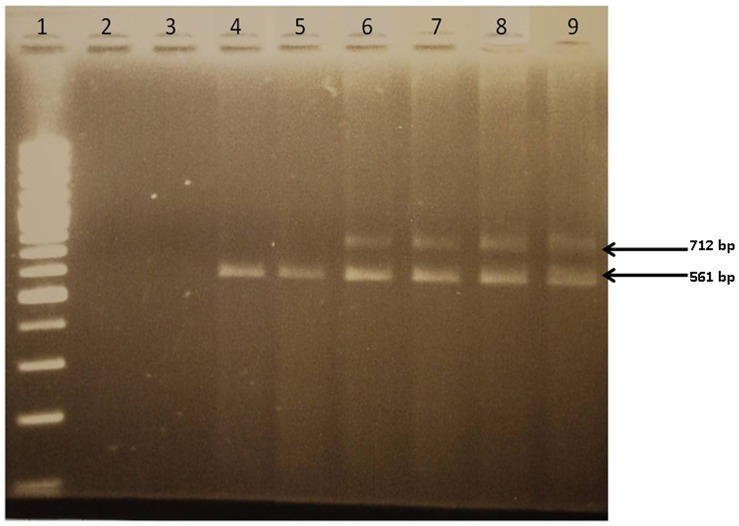
Figure 5. Analysis of cDNA from subjects harboring the IVS25+1G>A mutation versus controls.
cDNA analysis of PCR products resulting from the amplification of cDNA from subjects harboring the IVS25+1G>A mutation versus wild type controls, visualised after electrophoresis on a 2% ethidium-bromide stained agarose gel. Ladder; Lanes 2–3: No Template Control (NTC); Lanes 4–5: two wild-type subjects for the IVS25+1G>A mutation; Lanes 6–9 : subjects heterozygous for the IVS25+1G>A mutation.

