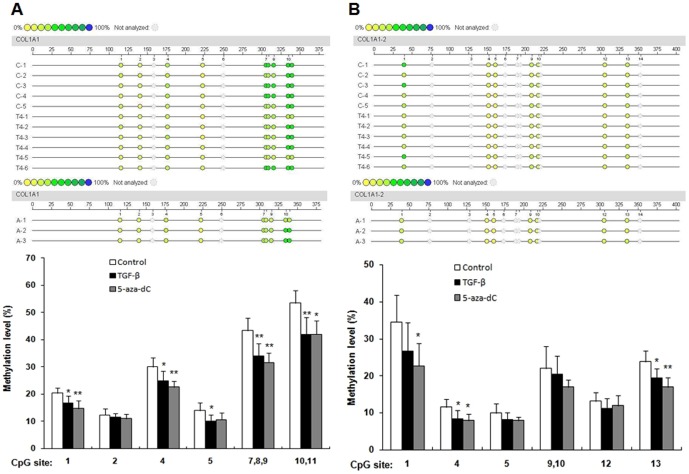
Figure 4. Methylation levels of the CpG sites in the COL1A1 promoter.
The methylation levels of CpG sites in COL1A1 promoter regions from the control group (without treatment), TGF-β group (treated with 10 ng/mL TGF-β1 for 48 h) and 5-aza-dC group (treated with 5 µM 5-aza-dC for 48 h) were compared. Sequenom MassARRAY platform was used for the quantitative methylation analysis. The colors of each circle represent the methylation level of each corresponding CpG unit. Quantitative methylation analysis results are shown in a color scale: yellow (∼0% methylation), green (∼50% methylation), and dark blue (∼100% methylation). The white circles represent the missing data at a given CpG site. Mean methylation levels of CpG sites in (A) COL1A1 promoter region-1 and (B) COL1A1 promoter region-2. Data are expressed as mean ± SD∶ n control = 5 (Sample: C-1 to C-5); n TGF-β = 6 (Sample: T4-1 to T4-6); n 5-aza-dC = 3(Sample: A-1 to A-3). *P <0.05, **P <0.01 (relative to the respective control).

